New Relic mobile monitoring offers valuable insights into the performance and crash diagnostics of Android, iOS, and hybrid applications. By leveraging mobile monitoring, you can enhance your app’s user experience, analyze HTTP and network performance, and facilitate better collaboration with backend teams. In this article, I will focus on using New Relic for Android applications. With Android mobile monitoring, you gain a comprehensive view of your app’s performance, supporting apps developed in Java or Kotlin.
What is New Relic mobile monitoring?
New Relic mobile monitoring is a comprehensive tool that provides developers with detailed insights into the performance, health, and user experience of mobile applications. It supports both native and hybrid apps across various platforms, including Android and iOS. By integrating New Relic mobile monitoring, you can track a wide range of performance metrics, diagnose crashes, and monitor network performance in real-time, helping to improve the overall user experience and app stability.
Core Features of New Relic mobile monitoring:
- Crash reporting: New Relic provides detailed crash analytics to help you understand the root causes of app crashes. It captures crash logs and stack traces, enabling developers to quickly identify issues, prioritize fixes, and ensure a more stable app experience for users. This feature allows you to track crashes in real-time and understand how often and under what circumstances they occur.
- Network performance monitoring: This feature tracks all network requests made by your mobile app, such as API calls, and provides detailed insights into their performance. You can monitor response times, success rates, and errors, and identify slow network calls that could be impacting your app’s performance. With this data, developers can optimize network usage and reduce latency, ensuring a smoother user experience.
- Response time monitoring: New Relic tracks the response time of different aspects of your mobile app, including user interactions, network requests, and other key events. By monitoring response times, you can pinpoint performance bottlenecks and optimize critical areas of your app that may be slowing down the overall experience.
- Detailed performance metrics: New Relic provides a wide range of detailed performance metrics, including app load times, app startup times, memory usage, CPU usage, and more. These metrics help you understand the overall performance of your app and identify specific areas where optimization is needed to improve efficiency and responsiveness.
- Custom events and metrics: New Relic allows you to define and track custom events within your app. You can create custom metrics for specific user interactions or app features, helping you gain deeper insights into user behavior and app usage. This customization enables you to monitor what matters most to your business, beyond standard performance metrics.
- Distributed tracing: Distributed tracing allows you to follow the journey of a user request across multiple services and systems, helping you understand how different components interact and where potential performance issues might lie. This feature provides an end-to-end view of user activity, making it easier to detect slowdowns, network latency, and errors that might not be visible through traditional monitoring methods.
Benefits of using New Relic mobile monitoring
- Proactive error detection: By continuously monitoring mobile app for crashes, performance issues, and errors, New Relic helps you proactively detect problems. This enables you to quickly resolve issues and minimize downtime or disruptions, improving the overall user experience.
- Enhanced user experience insights: New Relic provides valuable insights into how users interact with your app, helping you understand their journey and identify areas where the experience can be improved. Monitoring response times, crashes, and custom events allows you to fine-tune features and address pain points, leading to a more engaging and smoother user experience.
- Performance optimization: With detailed performance metrics and real-time data on network and response times, New Relic enables developers to optimize app performance efficiently. Identifying and addressing performance bottlenecks, such as slow network requests or high CPU usage, leads to faster load times, reduced latency, and an overall more responsive app.
- Reduced time to resolution: New Relic’s crash reporting and performance monitoring features allow developers to quickly pinpoint the cause of issues and resolve them faster. The detailed diagnostics make it easier to understand the severity and impact of problems, so teams can prioritize fixes based on user impact, improving the speed of issue resolution.
- Improved collaboration with backend teams: By providing detailed insights into both frontend and backend performance, New Relic fosters smoother collaboration between mobile developers and backend teams. Shared visibility into metrics like network performance and distributed tracing ensures that teams can work together to resolve issues affecting the overall app performance.
- Scalable Monitoring: New Relic scales with your app, making it suitable for both small projects and large-scale applications. As your app grows, New Relic can handle an increasing amount of data and user activity, allowing you to maintain high performance and stable operations over time.
By integrating New Relic mobile monitoring, we not only gain visibility into our app’s performance but also empower our team to deliver a better and more reliable app experience to users.
Integration of New Relic SDK into Android application
Before integrating the SDK with your Android app, ensure that you have reviewed the Android agent compatibility and requirements.
When integrating with New Relic, please follow the steps outlined in the Install the Android agent documentation.

Integrations and agents
Here, I will walk you through some key features provided by New Relic and the advantages they offer in improving the performance and user experience of our mobile apps.
After integrating your mobile applications with New Relic, you gain access to a detailed performance summary that offers valuable insights into various aspects of your app’s health.
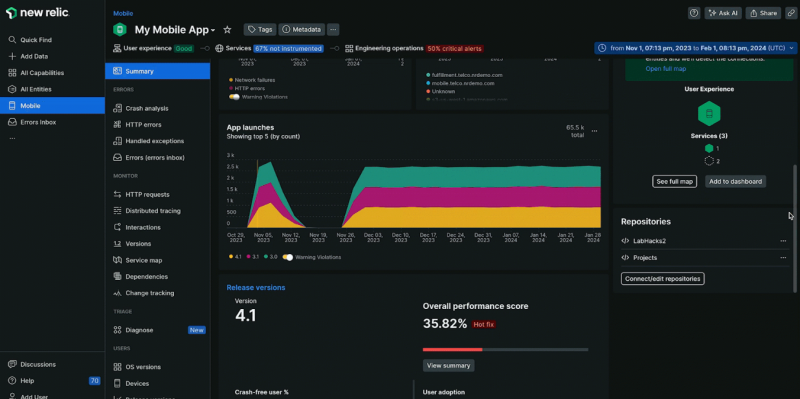
Performance summary
Once both the app and backend are integrated with New Relic, you will be able to view the connections between the entities along with distributed tracing, allowing you to track requests across services seamlessly. For further details, please refer to the image below.

Connections between entities
If you select the geography tab from the navigation bar, you will see a view displaying key metrics such as app launches, average HTTP response time, network failure rate, requests per minute, and total transfer size for the specified time period.

Geography
To simplify crash analysis, you can leverage New Relic mobile user journeys, which provide an intuitive way to track and understand app crashes. By using the user journeys feature, you can gain insights into key metrics such as app launches, crash rates, and average response times for specific user flows. This makes it easier to pinpoint issues and optimize the user experience based on real-time data.

User journeys
If you select the service map tab from the navigation bar, you will see a visual representation of your entities, allowing you to track and monitor their interactions across your system. This view helps in identifying dependencies, bottlenecks, and overall performance of the services in your application.

Service map
If you select the OS versions tab from the navigation bar, you can analyze the performance of your app across different operating system versions. This view provides insights into metrics like crash rates, response times, and user engagement, helping you identify any operating system specific issues and optimize your app’s performance accordingly.

Operating system versions
New Relic offers a wide range of powerful features to enhance application performance monitoring and observability. In this section, I have highlighted some key features for you. However, New Relic provides even more capabilities that you can explore in detail by exploring the platform.
Conclusion
New Relic mobile monitoring is a powerful tool that provides deep insights into the performance, stability, and user experience of mobile applications. By leveraging features such as crash reporting, network performance monitoring, response time tracking, and distributed tracing, developers can proactively detect and resolve issues, optimize app performance, and enhance user satisfaction. The ability to track custom metrics and collaborate effectively with backend teams further strengthens app development and maintenance. Integrating New Relic ensures that your mobile application remains reliable, responsive, and scalable, ultimately leading to a seamless experience for your users.
This blog post was originally published on the PickMe Engineering Blog and has been shared with permission

The views expressed on this blog are those of the author and do not necessarily reflect the views of New Relic. Any solutions offered by the author are environment-specific and not part of the commercial solutions or support offered by New Relic. Please join us exclusively at the Explorers Hub (discuss.newrelic.com) for questions and support related to this blog post. This blog may contain links to content on third-party sites. By providing such links, New Relic does not adopt, guarantee, approve or endorse the information, views or products available on such sites.


