In the world of asynchronous workloads, microservices are a key component in processing and routing events to trigger numerous architecture components and other microservices. In this blog, we will learn why observability for such distributed and asynchronous workloads is important.
What is Event-Driven Architecture (EDA)?
Event-Driven Architectures is software architecture pattern which is designed for multitude of events (change in any state of the system) to be processed or routed to the right microservice for the event to be consumed. EDA is primarily adopted to enable loose coupling between microservices and ensure the flexibility of events and event-driven invocation of microservices.
As Confluent defines Event-Driven Architecture (EDA):
Event-driven architecture (EDA) is a software design pattern that allows systems to detect, process, manage, and react to real-time events as they happen. With EDA, the second an event occurs, information about that event is sent to all the apps, systems, and people that need it in order to react in real time. From multiplayer games, online banking, and streaming services, to generative AI, over 72% of global organizations use EDA to power their apps, systems, and processes.
Some of the common use-cases include:
- E-Commerce Applications: In platforms where actions like "add to cart," "payment," "order delivery," and "notifications" are event-driven, EDA ensures these processes happen seamlessly in real time as events occur.
- Serverless Applications: Serverless architectures often rely on EDA, triggering specific functions or processes through events like API calls or state changes. Event buses, queues, or topics are commonly used to handle such triggers. You can read more about how Serverless Architecture leverages EDA.
When implementing EDA for serverless workloads within the AWS ecosystem, developers and architects typically focus on three key services:
- Amazon Simple Queue Service (SQS)
- Amazon Simple Notification Service (SNS)
- Amazon EventBridge
These AWS services are designed to facilitate event routing, acting as the bridge between event producers (microservices or actions that trigger events), and event consumers, which process those events.
In a microscopic view of our architectural patterns, it would be as simple as one of the AWS Services invoking another AWS Service. For example, an SQS queue might invoke a Lambda function, or a Lambda function could publish messages to an SNS topic.

This setup seems simple enough. What could possibly go wrong, right? However, in real-world scenarios, EDA is often deeply integrated into systems, with multiple event sources and messages routed to different destinations based on topics/queues. Let’s see how a classic architecture using EDA would look like in an eagles’ view.

In such setups, when you get error alerts, pinpointing the Service and Event responsible could be a classic “needle in a haystack” problem and that’s exactly where having an observability layer enables you to focus at the right stack or event.
Challenges with monitoring EDA
Yes, you can imagine that with a complex architecture using EDA at various touch points, the challenges of operating without monitoring are evident. However, introducing monitoring presents its own set of challenges.
Increased complexity
The complex architectures bring complexity in the ways you, as a developer or architect, approach instrumentation. Simply adding a Lambda Layer is not enough, as telemetry data from non-AWS Lambda functions must also be captured and sent to the observability and monitoring tools. This would mean implementing the CloudWatch Metrics Streams and integrating them to your observability platform like New Relic. By doing so, you can track telemetry data, such as the number of messages published to SNS topics or SQS queues, and identify potential delays in message delivery from an SQS queue to the destination Lambda function.
Telemetry overload and inconsistency
In distributed or EDA based environments, the volume of telemetry data can be overwhelming. Instrumented microservices and individual architecture components continuously send telemetry data to platforms like New Relic, resulting in a constant influx of information.
However, in many cases, not all components of the architecture are instrumented. This means you may receive telemetry data from one microservice or component, while another remains silent. This inconsistency adds significant complexity, making it difficult for developers, SREs, or architects to trace the complete event journey. Without comprehensive contextual logs or traces, identifying and resolving issues becomes a far more challenging task.
Idempotency becomes a nightmare
Handling idempotency can quickly become a daunting task, especially with services like EventBridge, SQS, and SNS on AWS, which do not guarantee single delivery of messages. The repeated delivery of events or messages makes it difficult to trace errors, identify their sources, or track the occurrence of events. This lack of clarity can significantly complicate observability and distributed tracing, turning them into major challenges.
Performance monitoring
Telemetry data can originate from various components and microservices, bproviding essential performance metrics for EDA applications. A key challenge in such systems is managing end-to-end latency, which arises due to the asynchronous nature of the architecture. Additionally, it is crucial to monitor resource utilization and performance metrics across the distributed components to ensure efficiency.
Custom dashboards
Now that you are familiar with how complex instrumentation of native managed services such as EventBridge, SQS and SNS is, relying solely on CloudWatch Metrics would mean that, as an SRE, developer, or architect, you'd have to build custom dashboards only to derive the metrics from CloudWatch and build insight from them.
Bringing the observability to EDA
Now that you are aware of the challenges with monitoring EDA architectures, let's understand how the core pillars of observability can enhance telemetry data collection and provide deeper insights into these complex systems.
Metrics
Metrics provide quantifiable insights into system behavior, offering a clear view of performance across various components. From core compute metrics like throughput, concurrency, and error rates in classic Lambda Functions to service-specific metrics in EDA, such as messages received, queue health, delayed messages and more, gets you the visibility of how the system is performing as a whole.
Events
In the context of EDA, events are discrete occurrences that signify a change in state, such as “message arrived”, “message delivered”, “message published”. Events can also be leveraged to trigger alerts using the event-based alerts to notify you when too many messages fail to deliver.
Logs
Logs provide detailed records of events and the context surrounding their execution. They can include information like “message published to topic” so, from the business logic, you are aware that message was published to the designated topic. Adding metadata to logs can further help pinpoint the exact location of the execution for efficient troubleshooting.
Traces
In the distributed microservice architecture like EDA, it’s important to trace the entire execution journey from initial invocation to events that trigger other microservices or architectural components. Visualizing these traces through a chain of spans provides valuable insights into the performance and latency of specific executions.
The observability pillars - MELT (Metrics, Events, Logs and Traces) - offer comprehensive visibility into your system's behavior. Together, they enable swift problem identification, root cause analysis, proactive monitoring, and effective alerting, ensuring a more resilient and efficient system.
New Relic integrations with SQS and SNS
Observability is critical for EDA, and New Relic simplifies this process with out of the box integration capabilities for Amazon SQS and Amazon SNS. These integrations allow developers and architects to seamlessly connect with CloudWatch Metrics and New Relic, which has the predefined dashboard configured.
First, let us integrate Amazon CloudWatch Metrics before setting up dashboards.
Setup CloudWatch metrics streaming
The metrics for SQS and SNS are sourced from the Amazon CloudWatch Metrics. To complete the integration, follow these steps:
Sign in to your New Relic account and navigate to “Integrations & Agents”.
From here, navigate to “Integrate your AWS Account”, select both logs and metrics and continue.
Under “Choose a setup method”, select with the infrastructure as code (IaC) option of CloudFormation and follow the on-screen instructions to complete the setup.

Now that the integration is setup, you should see the CloudWatch metrics flowing into your New Relic account before you setup Amazon SQS and Amazon SNS dashboards.
Amazon SQS dashboard
New Relic offers an Amazon SQS integration that provides a comprehensive dashboard to monitor key metrics sourced from CloudWatch including approximateAgeOfOldestMessage, approximateNumberOfMessagesDelayed, numberOfMessagesSent, numberOfMessagesReceived, among others.

Additionally, with NRQL, you can build your own custom baseboards tailored to your needs using simple queries. For example, you can track the number of messages sent via SQS using the following query:SELECT sum(`aws.sqs.NumberOfMessagesSent`) FROM Metric since 1 month ago until now

NRQL query for SQS Number of Messages sent
Furthermore, you can add in queries to the existing dashboard and setup alerts accordingly.
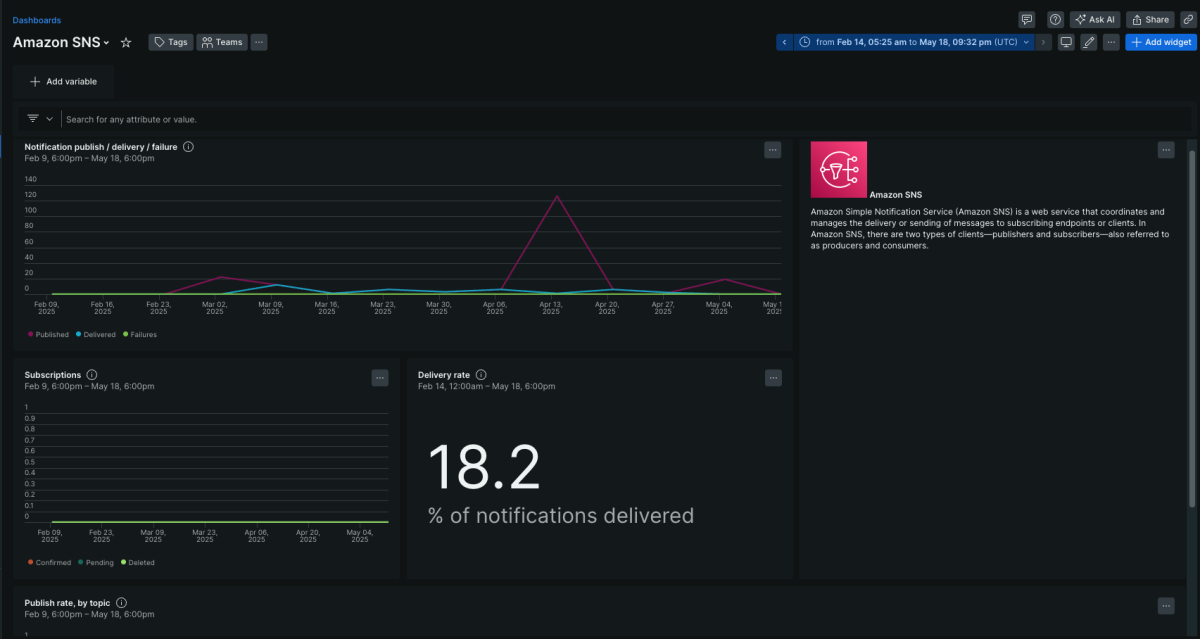
Amazon SNS Dashboard
New Relic provides an Amazon SNS integration which creates a dashboard for metrics derived from the CloudWatch Metrics such as numberOfMessagesPublished, numberOfNotificationsDelivered, SubscriptionsConfirmed on topic, and SubscriptionsDeleted on topic, to name a few.
Since the metrics are available in NRDB, you can also run queries such as SELECT sum(`aws.sns.NumberOfMessagesPublished`) FROM Metric since 1 month ago until now to know the number of messages published. Giving you an additional feasibility to add metrics to your pre-built dashboard.

Additionally, you can add in queries to the dashboard and setup alerts accordingly similar to the SQS integration and pre-built dashboard. Follow our guide to learn more and setup your Amazon SNS monitoring integration.
Next steps
By now, you’ve gained an understanding of Event-Driven Architecture (EDA) and the unique observability challenges it presents, particularly in distributed systems with numerous microservices and managed services. You’ve also seen why observability is crucial in maintaining and monitoring these systems effectively. Additionally, you’ve learned how CloudWatch metrics, combined with integrated dashboards, can enhance visibility into the performance of key EDA components like Amazon SQS and Amazon SNS.
Set up your CloudWatch Metrics and take the next step by exploring our guide to configure the Amazon SQS monitoring integration and Amazon SNS monitoring integration. Start building a strong foundation for EDA observability with New Relic’s Amazon SQS and Amazon SNS integrations.

The views expressed on this blog are those of the author and do not necessarily reflect the views of New Relic. Any solutions offered by the author are environment-specific and not part of the commercial solutions or support offered by New Relic. Please join us exclusively at the Explorers Hub (discuss.newrelic.com) for questions and support related to this blog post. This blog may contain links to content on third-party sites. By providing such links, New Relic does not adopt, guarantee, approve or endorse the information, views or products available on such sites.


