How can you address what you don’t know? Monitoring Windows logs is essential for gaining insights into your servers and desktops — whether you’re troubleshooting issues, optimizing performance, or keeping track of system activity. Since IT teams are often pulled in multiple directions, understanding how Windows logging works is crucial for resolving problems and maintaining secure, efficient systems.
The Windows event log serves as a centralized repository for logged data from both the operating system and various applications. This structured format makes it easier to search, analyze, and interpret data, helping you uncover what has happened and how your systems are performing. By properly configuring these logs, you can unlock their full potential and use them as a powerful tool for system management.
In this article, we’ll cover the fundamentals of Windows logging and provide a guide on how to view logs on both desktop and server machines.
What is Windows logging?
In Windows logging, logged activities are called ‘events’ and stored in different types and subtypes of event logs.
- Windows logs are logs for Windows OS and application events
- Applications and Services Logs are individual logs that give insight into applications and services running on the system
Event Viewer is the main application on Windows to view event logs. We’ll show you how to use Event Viewer.

Event logs can be viewed as text or XML files, making them easy to read and analyze using observability tools, such as in New Relic.

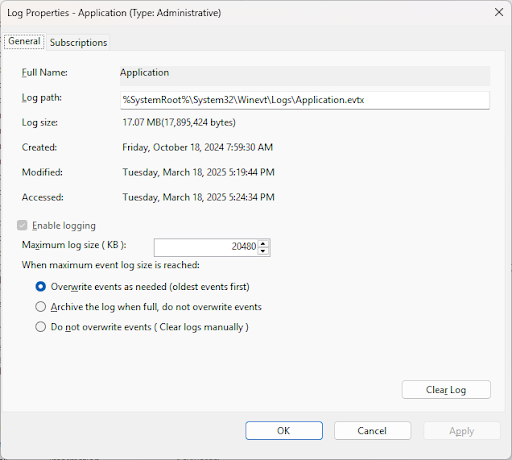
You can configure Windows logging using Event Viewer. In the Properties window for each event log, you can set how and where logs are stored and the maximum size of each log file.
Understanding Windows event logs
Windows logging categorizes logs under Windows Logs, as well as Applications and Services Logs. Some events can appear in more than one place. Selecting an event displays details about that event.

The Event Viewer provides easy-to-read information about any event. Some logged events include both problem and solution information to help administrators quickly solve problems. Other types of logs are best used with other tools to analyze them quickly for more accurate diagnosis and troubleshooting.
Types of Windows event logs
Windows Logs record both system-wide and operating system events. These are classified as:
- Application: These events are related to a software application—whether part of the OS or another application running on the system.
- Security: These events are related to security activities, such as access. They are considered successful (e.g., a successful login) or failed (a failed login attempt).
- Setup: These events are related to installation and updates.
- System: These events are related to events triggered by the operating system itself.
- Forwarded events: These events are a collection of logs from other computers.

Applications and Service Logs record events triggered by hardware components and Windows and application software running on the machine in the Windows environment. There are four main subtypes used to classify the type of event triggered by the application or service:
- Admin: These events identify both a problem and a solution that can provide answers for administrators; for instance, an application cannot attach to storage or a printer. Typically, the problem is well-documented or provides a message on how to solve the problem.
- Operational: These events can be used to help diagnose a problem or occurrence and can be used by other tools to help understand the problem. For example, a printer added to or removed from the system might trigger an operational event.
- Analytic: These events, when enabled, can quickly fill an event log. Analytic logs are not enabled by default and should be enabled only while trying to evaluate performance issues and troubleshooting.
- Debug: These events are used by developers to help troubleshoot problems with their applications. Debug logs are disabled by default.

Analytic and Debug logs are not shown in the Event Viewer tree by default. They can be exposed by clicking on the View menu in the Event Viewer and selecting Show Analytic and Debug Logs. Then, each log, when needed, must be enabled by selecting the particular log and enabling it by:
- Clicking Enable Log in the Action pane or in the log Properties.
- Right-clicking on the log name in the Event Viewer tree and selecting Enable Log, or enabling it in the Properties dialog.
A third item in the Event Viewer tree is Subscriptions, which shows what other computers are sending Windows logging data to the local machine. The Windows Event Collector Service must be enabled to collect logs from other computers. This article does not cover Subscriptions.
What’s in an event log?
Event logs are structured in standardized format, making them easy to read and digest by other tools that can read them. Although some logs vary in the data they provide, here are the main elements of an event log:
- Log name: The log name indicates the type of event it is, such as system, security, setup, application, and/or what application sent the event to the log.
- Level: LIndicates the severity of the event, such as informational, a warning, or a critical error. (See below.)
- Date/time: Indicates when the event occurred.
- Source: Identifies what application sent the event to the log. In some cases, this is the same as the Log Name.
- Event ID: The event ID provides an identifier for each event. It should directly relate to a message that indicates the cause of the problem, which can be helpful to administrators.
- Task category: The task category adds more information to help with debugging an issue. Developers can define categories to provide context for a particular event.
- User: This pinpoints the logged-in user related to the event. If the event is from a system component, a user might not be shown.
- Computer: This shows the name of the machine that logged the event.

Event levels
Events are classified with different levels of severity and may include a Level ID (not to be confused with the Event ID). Lower numbered Level IDs are more critical than higher values. The default Windows Event severity levels are (default Level IDs are shown in parentheses):
- Verbose (100): Shows progress or success of a task. These provide more information than the Information level.
- Information (80): Indicating successful completion of an operation.
- Warning (50): Could indicate a possible future Error or Critical problem, but not significant at the time.
- Error (40): Indicates a significant event that can result in loss of data, but may not need immediate attention.
- Critical (30): Indicates a severe problem, such as an application or service crashing. These require immediate attention.
Security audit success and failure
Security logs show results as success or failure.
- Success means an event completed successfully. For example, a user logged on to a Windows machine.
- Failure means an event started but did not complete successfully. For example, a failed log-on attempt.
How to access Windows logs
The main application for viewing event logs is Event Viewer. It is integrated into both Windows desktop and server operating systems. The quickest way to open Event Viewer is to:
- Click Start.
- Type Event Viewer.
- Press the return key or click on Event Viewer in the search results.
Event Viewer can run in many instances, and each instance can be configured differently for viewing. For example, you can show Analytic and Debug logs in one instance, while not showing them in another.
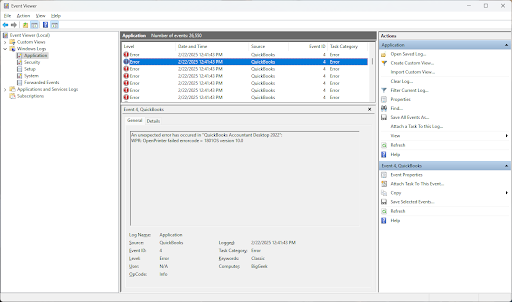
Event Viewer opens in an overview screen, from which you can see a list of events and logs. Event Viewer is organized in three panes: Navigation (left), Detail (center), and (Actions) right.
- The Navigation pane shows the log tree, which is expandable.
- The Detail pane lists the summary information (in the Overview screen) or the events and shows the preview pane (if enabled in the View menu) of a selected event.
- The Actions pane shows the actions you can take for the highlighted selection in the Navigation pane. The Actions pane items duplicate what appears when you right-click on a selected item in the tree.

The overview screen shows the following:
- Summary of Administration Events shows the total events for all Event Types over the last week.
- Recently Viewed Nodes shows recently viewed nodes from the newest to oldest. To open a node, double-click on it.
- Log Summary shows the major properties of each log file. Double-click to open the events for the log.
Other ways to access Windows Event Viewer
Event Viewer is a standard application in Windows desktop and server, but it is accessed in different ways. The fastest and common method was described above. Other ways to access Event Viewer include the following:
- Windows search: Click the search icon and begin typing Event Viewer until you see Event Viewer as a search result. You can pin Event Viewer to the Start menu and taskbar.
- Start Menu: Event Viewer may be in the Start Menu. You can pin it to the Start menu and task bar.
- Computer Management: Open Computer Management and click Event Viewer in the Computer Management tree.
- Control Panel: Depending on the OS, Event Viewer may be an item in the Control Panel.
- Server Manager: Open Server Manager on Windows Server, open Tools, and click Event Viewer.
- Windows Admin Center: If you use this browser-based application, open it in a supported browser and click on Events.
- Windows Component Service: Open Component Services and click Event Viewer in the left column tree.
- Run prompt: Open the Run prompt and type “eventvwr” to start Event Viewer.
- Command prompt or Windows PowerShell: Open the command prompt or Windows PowerShell window and type eventvwr or eventvwr.msc to launch it.
Use the method that works best for you in your operating environment.
Using Windows Event Viewer
You can learn and understand a lot about the operating system and applications using Event Viewer. Some of the typical uses and actions are covered here.
Finding and filtering events and creating custom views
Instead of randomly searching logs, you can use filters to search for specific events or create custom views of multiple events. The more you know about what to search for or the view you want to see, the more comprehensive the search will be. Some information to include are as follows:
- Time at which the issue was encountered.
- Event level (Error, Warning, etc.)
- Application or system process in which it occurred.
- User and computer.
With this information, you can search for the event manually in the appropriate log or use a filter to find the relevant information. Or you can create a custom view of multiple event types and conditions. For any of these, do the following:
- Select a log in the Navigation pane.
- Right-click and select Filter Current Log… to filter the log or select Create Custom View… to create a custom view. You can also click on the same item in the Actions pane. This opens the filter or custom view window.
- Fill in the information you have available and click OK.

Saving event logs
You may need to use other tools outside Event Viewer to enhance your analysis or for troubleshooting a problem. To do that, save the events in a log to a local file and use it as input to your tools.
- Select the appropriate log file in the Navigation pane.
- Right-click Save All Events As… from the pop-up menu or click the same item in the Actions pane.
- Choose a path and filename for the exported event records.
- Click Save.
Clearing event logs
If you need to clear all events in a log:
- Select a log in the Navigation pane.
- Right-click on the log name and select Clear Log… from the pop-up menu or click the item in the Actions pane.
Saving event details
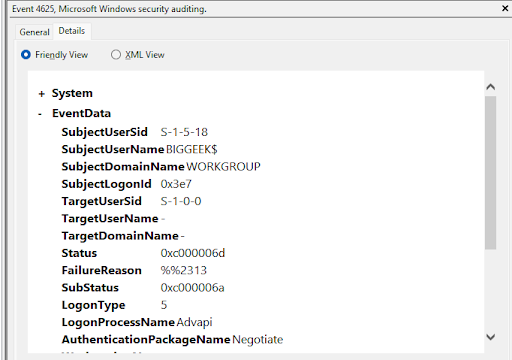
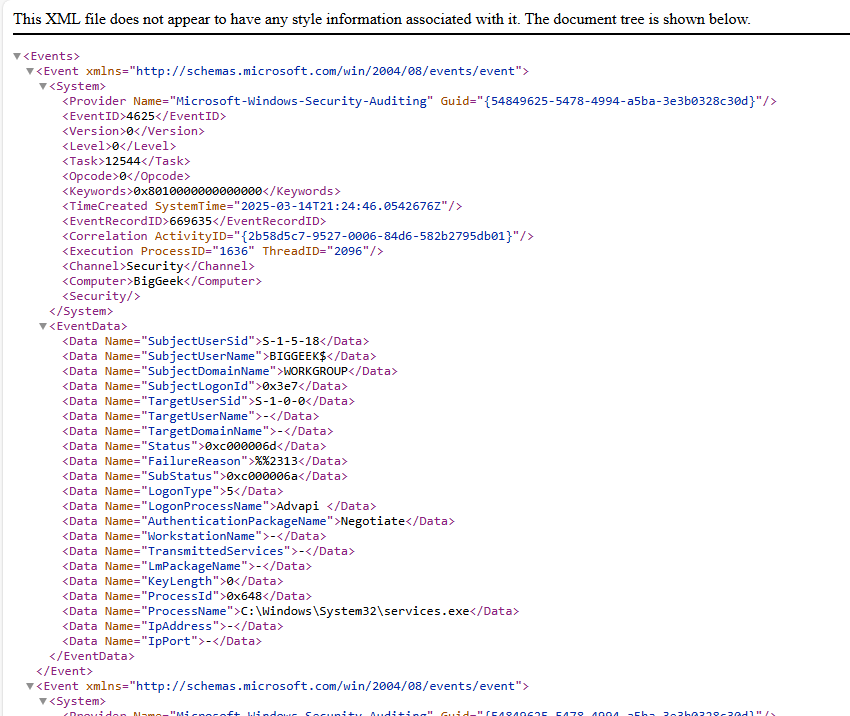
The Event Details lists all the information recorded by the event. It is shown in the Details pane and can be viewed in an intuitive text format or as XML tagged data as shown in examples below.


Inside Event Viewer, Details can be used to track down problems, but you may want to save a specific event’s data outside Event Viewer for other purposes. To save a specific event’s content,
- Select the log and event or multiple events you want to save.
- Right-click the selection and click Save Selected Events…
- Choose the path, filename, and file type to save.
You can save the data as an Event Viewer file (opened in Event Viewer as a saved log), text, an XML tagged file, or in CSV format.
Here are some examples of saved events.


Importance of Windows logging
Logs are your window into every machine and your entire infrastructure. Windows logging provides details about each event’s source, user, computer, event type, ID, level, and more. This information will help you track down problems and work out solutions quickly.
Using Windows event data externally in other tools enables insight into what your systems are doing and accelerates problem-solving. Incorporating Windows event logs into your observability platform, such as New Relic, will provide you with critical knowledge and help you solve problems faster than manually searching logs.
Next steps
Gain valuable insights into your Windows-based infrastructure with New Relic. Our Observability Platform seamlessly integrates with your Windows logging system, making it effortless to extract and analyze critical data. Leveraging advanced AIOps technologies, New Relic delivers intelligent observability, empowering administrators to optimize applications and services across the entire technology stack.
Discover how the New Relic Observability Platform can transform your operations—get started today or contact us to schedule a demo.
The views expressed on this blog are those of the author and do not necessarily reflect the views of New Relic. Any solutions offered by the author are environment-specific and not part of the commercial solutions or support offered by New Relic. Please join us exclusively at the Explorers Hub (discuss.newrelic.com) for questions and support related to this blog post. This blog may contain links to content on third-party sites. By providing such links, New Relic does not adopt, guarantee, approve or endorse the information, views or products available on such sites.


